

Overall Participant Statistics
You can view the overall participant statistics for your survey under: Login » Surveys » Reports » Dashboard » Participant Statistics.
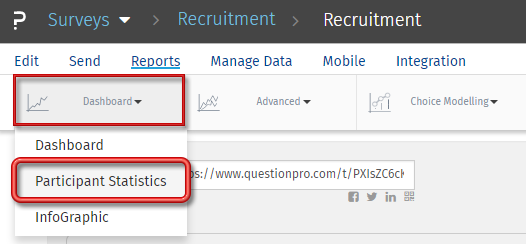 Click on the Participation Statistics menu in the drop down to see the Overall Participant Statistics data for the survey.
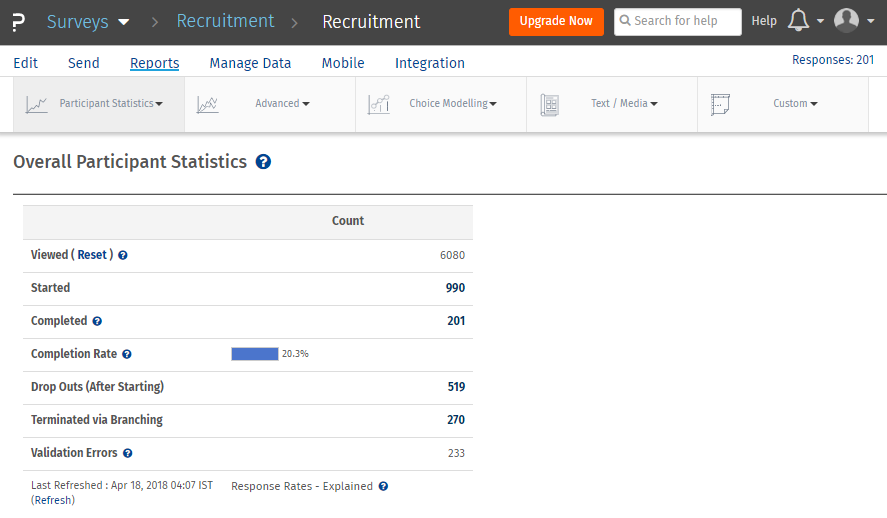
- Viewed: This is the total number of users who click on the link for the Survey. Every time your survey is requested the view count is incremented and updated. The respondent does not necessarily have to start the survey. It also includes started and completed count.
- Started: This is total number of respondents that have started the survey. If your survey has branching or page-breaks, a response is recorded as "Started" if the "Continue" button on the first page is clicked.
- Completed: The completed count is all respondents that have gone through the whole survey and completed it, that is clicked on the Finish button on the last page of the survey.
- Completion Rate: This is equal to Completed Survey Responses divided by the number of Started Survey Responses.
- Drop Outs: This is the number of respondents who start the survey but do not complete the Survey.
- Terminated via Branching: If you have setup the branching in your questions to terminate the survey for a criteria then the number of terminated respondents will be displayed in this column.Please note that this column will only be displayed if you have setup branching to termination.
- Validation Errors: This is the number of times someone has encountered a validation error during the survey.
By default Respondents can skip questions and proceed with the Survey and Complete it without answering questions. The Survey is considered complete when the Respondents click on the Finish/Submit button on the last page of the Survey. To avoid blank survey responses you can validate the Questions and make them required. For more information please check the Force a Response help link below.
Under the Reports tab all statistics are captured including test data, repeat surveys, surveys accessed via URL, etc. However, under the Send Survey tab the statistics are captured only for the Survey invitations that were delivered for the email lists.
The data-analysis represents all users who have chosen to answer a question. In some cases users do not answer all the questions. In such cases, the total count of users completing the surveys will be different than the data-analysis.
For surveys that do not have page-breaks or Branching the started count should be equal to the completed count. If the started count is more than the completed count, that number represents the "drop outs" after starting the survey.
The participation is a relative percent based on the total number of users who have taken any survey compared to your current panel size.
The total responses to any question should be less than or equal to the Started count, but may not be equal to the completed count. If the respondents chose not to answer that question then the count will always be less than the Started count. If you have required answers to questions on your survey, and the total does not add up to the “started” or “completed” count, these are drop-outs where users have chosen not to answer the question after starting the survey.
This feature is available with the following licenses :